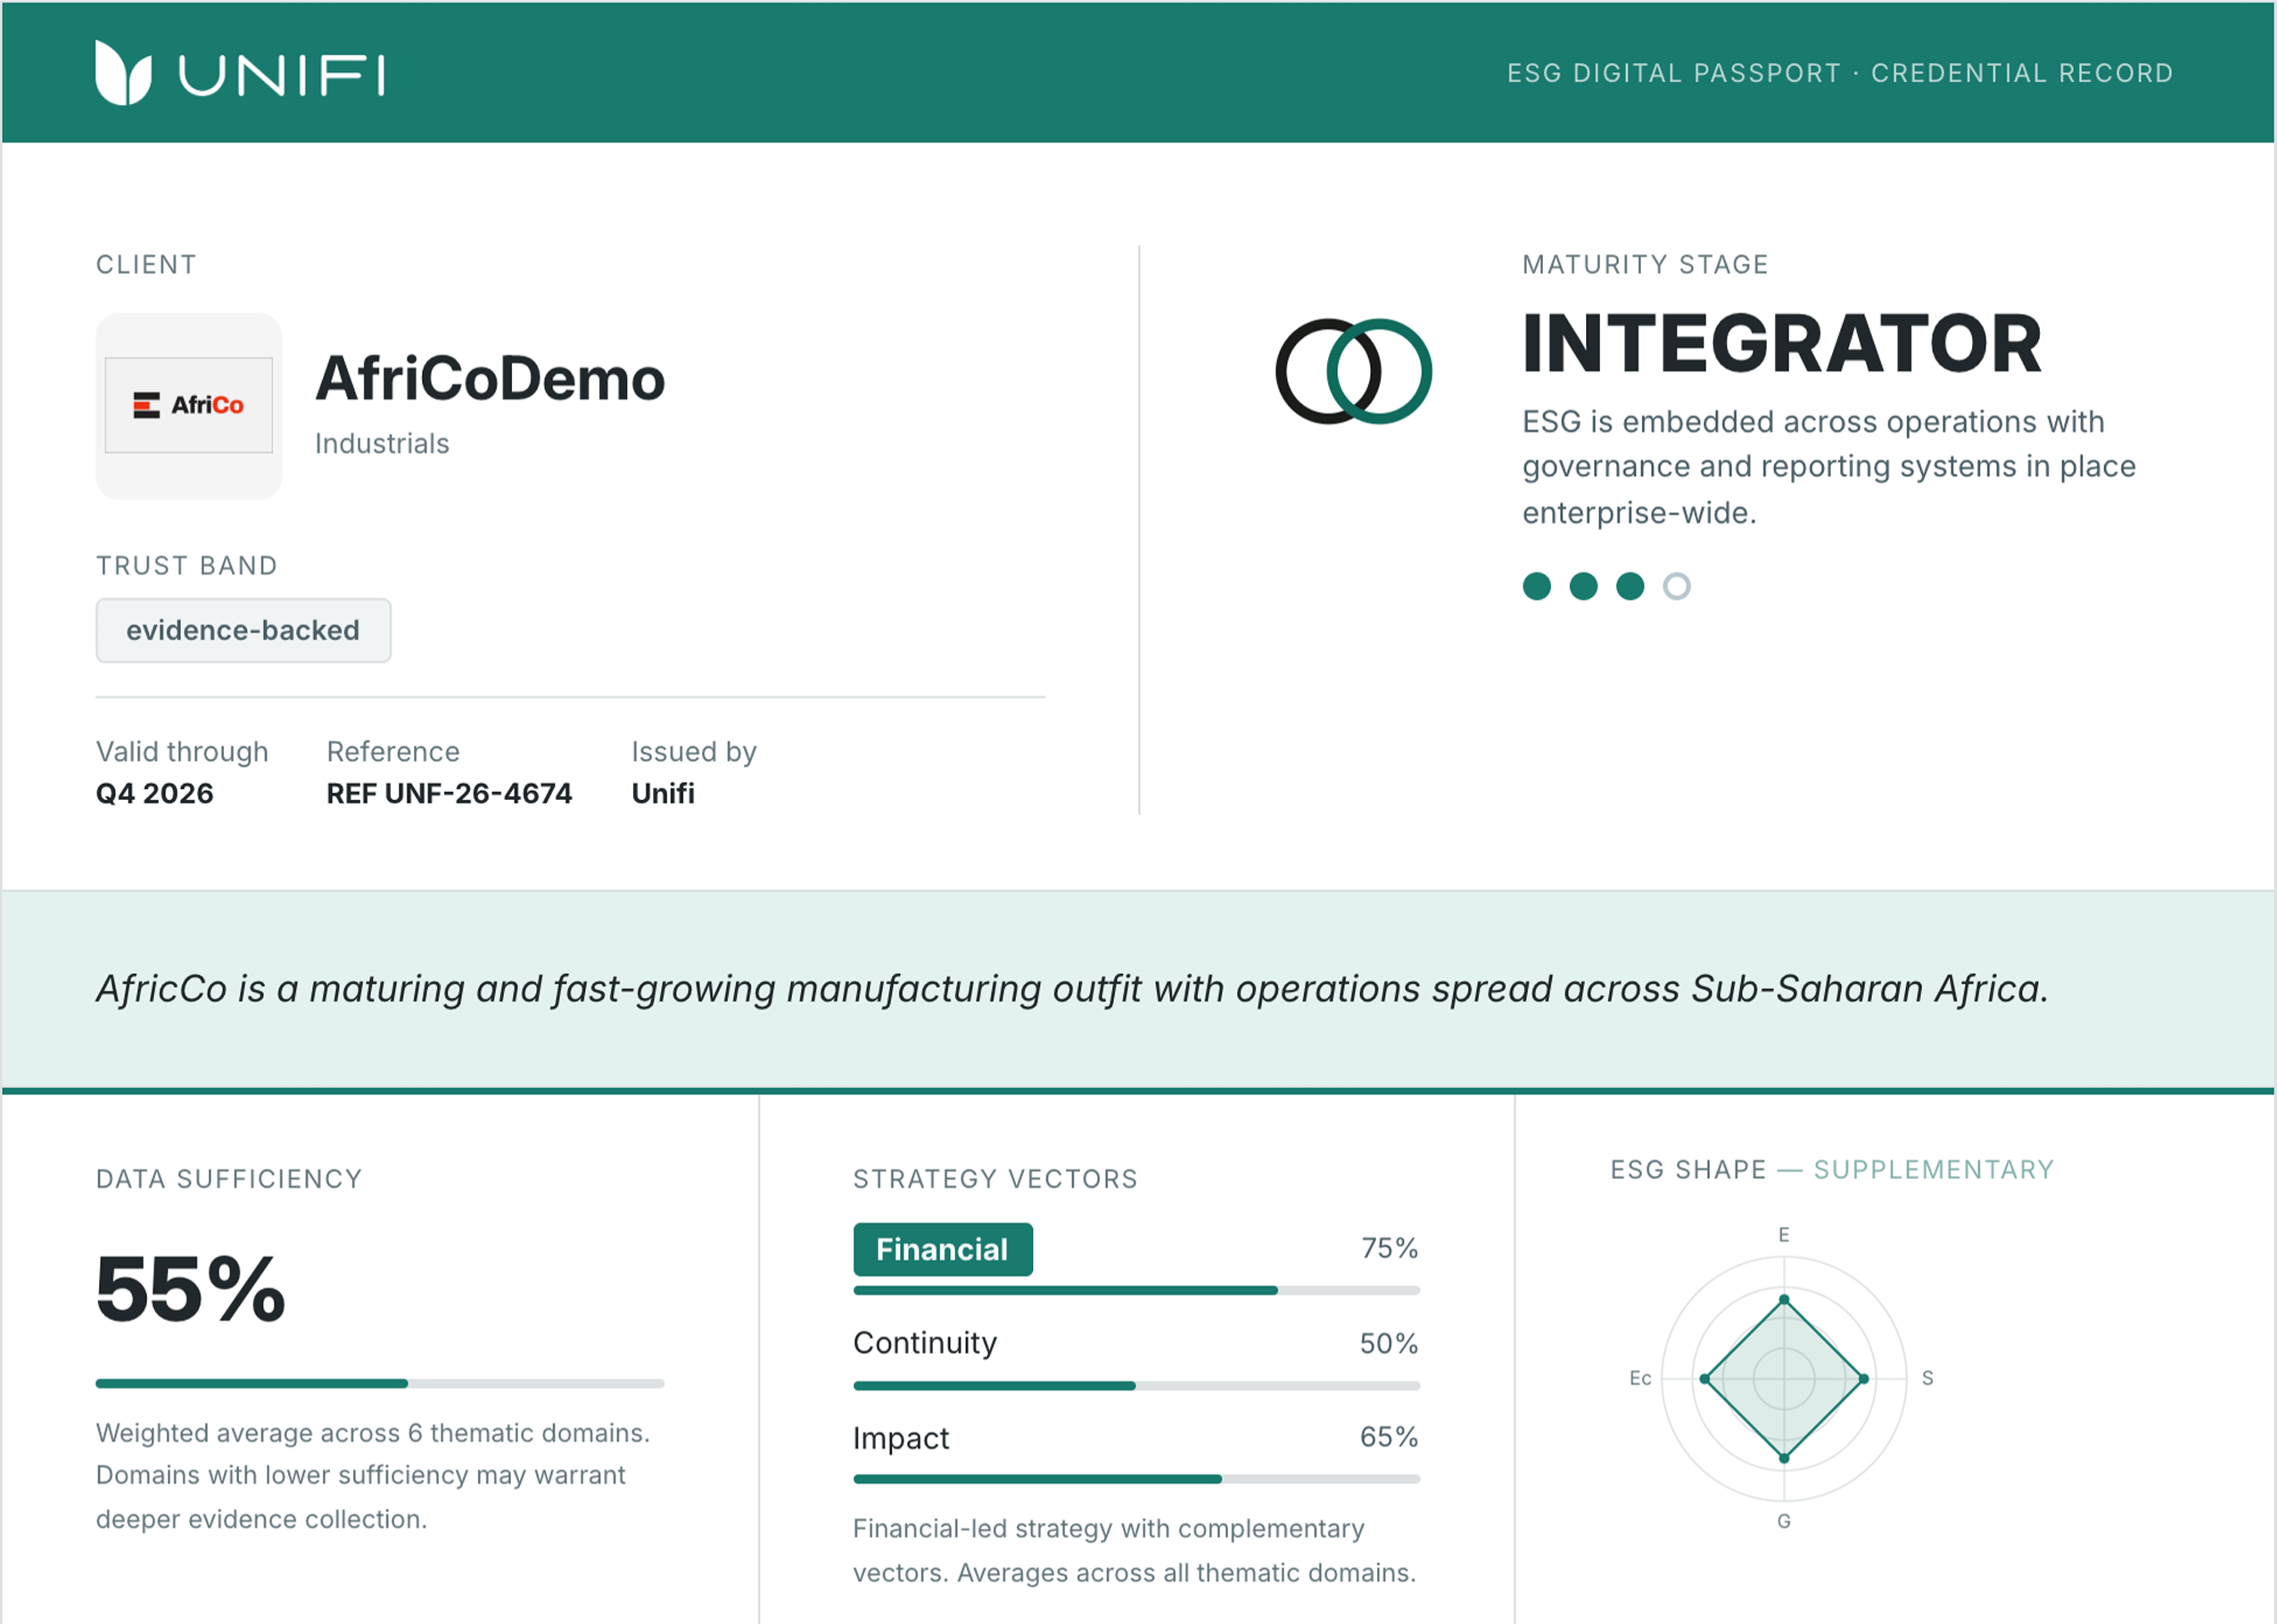
 JSE ESG UNIFI Data Suite
South African context. Institutional intelligence.
South Africa’s ESG Data. Built for the local context.
Purpose-built ESG intelligence for the JSE-listed universe. Explore South African transformation, procurement, community investment and carbon tax metrics alongside internationally recognised ESG indicators.
Developed by UNIFI in partnership with the JSE.
The South African differentiator
Built for South Africa. Not retrofitted from a global template.
Global ESG indicators tell part of the story. Understanding South African companies also means understanding transformation, economic participation and local investment. This suite brings those measures into the same analytical view.
01 / Transformation
B-BBEE
Compare disclosed scorecard levels and transformation progress in the context of South Africa’s empowerment framework.
02 / Participation
Enterprise & Supplier Development
Examine reported ESD investment and how companies support enterprise growth and supplier participation.
03 / Local value
Local Procurement
Assess disclosed local and B-BBEE procurement spending alongside total procurement to understand localisation.
04 / Communities
Corporate Social Investment
Compare community investment commitments and CSI spending relative to company scale and sector peers.
05 / Carbon exposure
Carbon Tax
Explore reported carbon-tax payments alongside emissions and energy metrics, with local applicability in view.
Company-disclosed data, with explicit non-disclosure markers. A missing disclosure is not a zero value or a finding of non-compliance.
What’s inside the dataset?
One dataset. Four dimensions. A uniquely South African perspective.
E / Environmental
Resources & emissions
GHG emissions, Scope 1–3, energy consumption, renewable energy, water, waste and carbon tax.
S / Social
People & participation
B-BBEE, ESD, CSI, local procurement, employment, training, bursaries and job creation.
G / Governance
Leadership & oversight
Board composition, independence, diversity, board committees and meeting attendance.
Economic
Value & contribution
Revenue, procurement spending, taxes and government payments.
Real ESG insights
What South Africa’s ESG data reveals
Five studies show why local context changes the analysis. Expand a study to see its evidence, sample and interpretation.
01 / South Africa’s ESG data thins out where it matters most
83% → 8%
Headcount disclosure is widespread. Coverage becomes thinner for measures of local investment and carbon-tax payments.
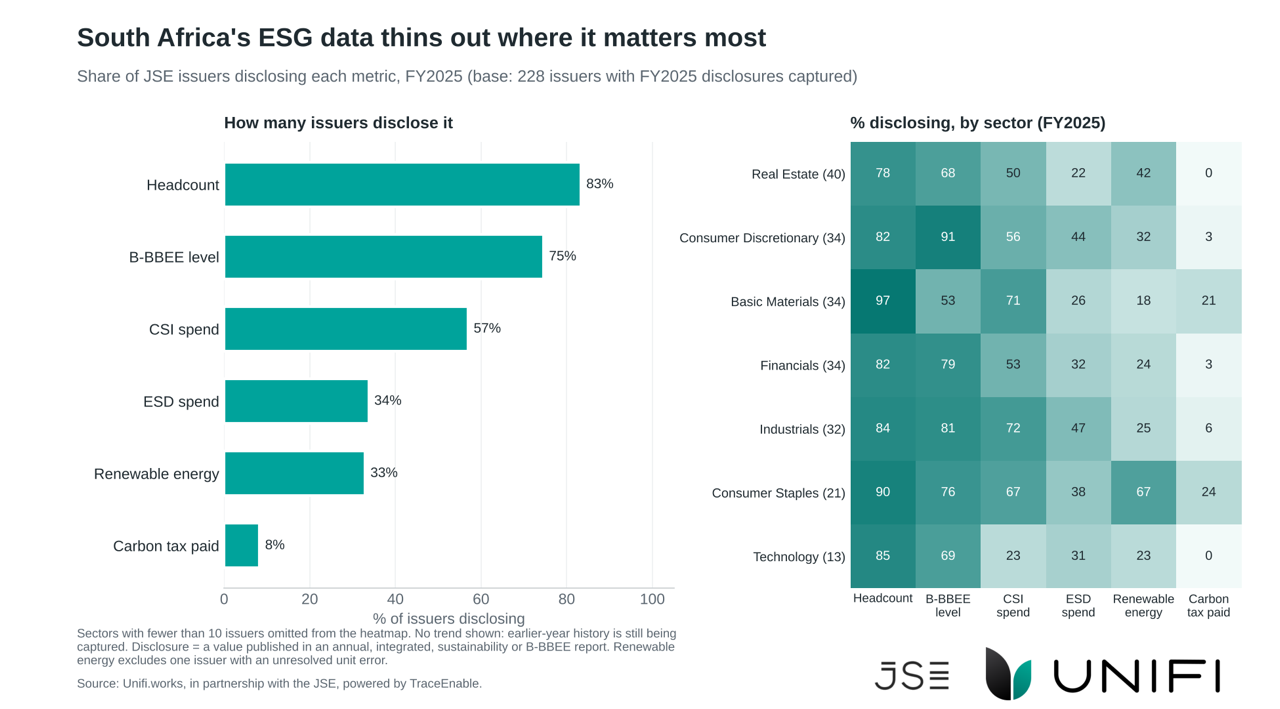
FY2025 · 228 issuers with captured disclosures. Headcount: 83%; B-BBEE level: 75%; CSI spend: 57%; ESD spend: 34%; renewable energy: 33%; carbon tax paid: 8%.
Disclosure means a value published in an annual, integrated, sustainability or B-BBEE report. Carbon tax applies only above relevant statutory thresholds; 8% does not mean that all remaining issuers failed to disclose a tax liability. Sectors with fewer than 10 issuers are omitted from the heatmap. Earlier-year capture is incomplete, so no disclosure trend is inferred. Renewable energy excludes one issuer with an unresolved unit error.
Source: Unifi.works, in partnership with the JSE, powered by TraceEnable.
02 / Where transformation is won
63% at Level 1
Financials lead the sectors shown. Sector context matters when interpreting transformation outcomes.
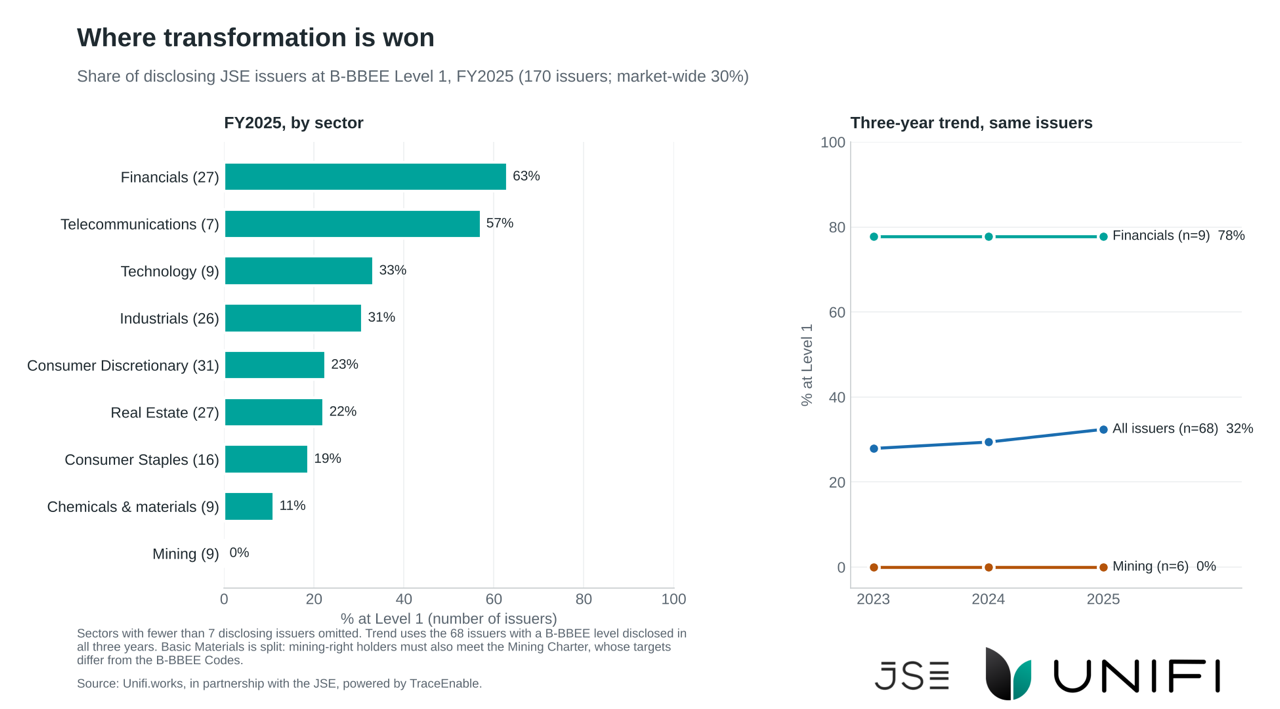
FY2025 · 170 B-BBEE level disclosers market-wide. Financials: 63% of 27 disclosers at Level 1; Telecommunications: 57% of seven; Mining: 0% of nine.
Among the same 68 issuers reporting in all three years, Level 1 representation increased from 28% in FY2023 to 32% in FY2025.
Sectors with fewer than seven level disclosers are omitted from the sector chart. Mining is separated from Chemicals & materials: mining-right holders must also meet Mining Charter requirements, whose targets differ from the general B-BBEE Codes. The three-year sector trends use smaller balanced samples: Financials n=9 and Mining n=6.
Source: Unifi.works, in partnership with the JSE, powered by TraceEnable.
03 / R1 in every R1,000
≈0.11% of revenue
Median CSI intensity is roughly R1 in every R1,000 of revenue. Relative measures make companies of different sizes more comparable.
CSI intensity, by sector
| Sector / cohort | Issuers | Median CSI / revenue |
|---|---|---|
| All benchmarked issuers | 144 | 0.109% (≈0.11%) |
| Real Estate | 21 | 0.197% (≈0.20%) |
| Basic Materials | 25 | 0.196% (≈0.20%) |
| Industrials | 25 | 0.076% (≈0.08%) |
| Technology | 5 | 0.065% (≈0.07%) |
Verified summary from the supplied workbook. The original published CSI chart has not yet been supplied.
CSI benchmark analysis · n=144. In the separate panel of 59 companies reporting rand CSI spend in both FY2024 and FY2025, the median company-level change was +11.2% (approximately 11%).
Benchmark intensity normalises both CSI and revenue to USD. Sectors with fewer than five issuers are omitted. The benchmarking cohort and the two-year spending panel are different samples. The summary workbook does not specify a common reporting period for all 144 benchmark observations; confirm the benchmark anchor period before publication.
Source: Unifi.works, in partnership with the JSE, powered by TraceEnable. CSI intensity: Unifi Benchmark Layer; supplied chart summary workbook (16 October 2026 export).
04 / One company, four-fifths of the bill
81% from one issuer
The published study shows a highly concentrated total of reported carbon-tax payments.
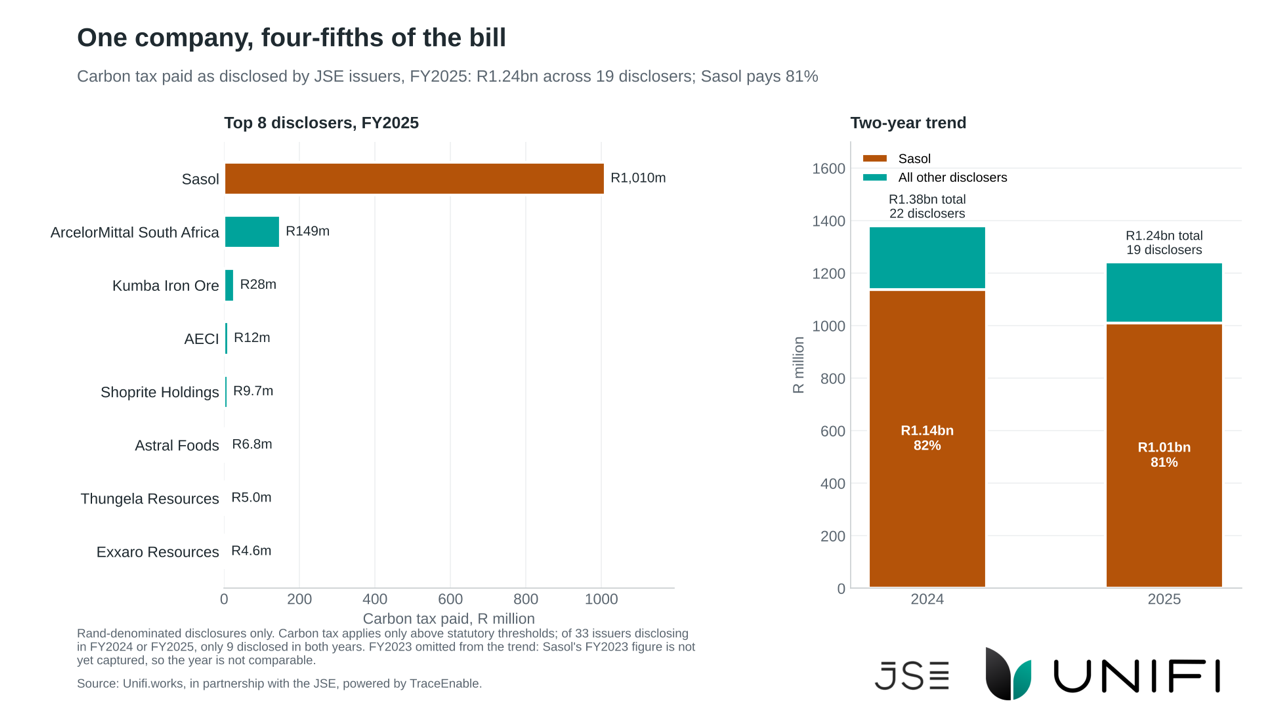
FY2025 · 19 disclosers · rand-denominated payments only. R1.24bn disclosed in total; Sasol R1.01bn (approximately 81%); ArcelorMittal South Africa R149m.
Provisional — verification outstanding. The supporting workbook flags a possible Sasol fiscal-year comparative issue (R1,010m versus R832m) pending fiscal-year re-export. These published figures require confirmation before publication.
These are disclosed payments, not the total South African carbon-tax base. Carbon tax applies above statutory thresholds. Only nine of the 33 issuers in either FY2024 or FY2025 disclosed in both years, so changing totals are not a like-for-like trend. FY2023 is omitted because Sasol’s figure was not yet captured.
Source: Unifi.works, in partnership with the JSE, powered by TraceEnable.
05 / The levels don’t move
66% held their level
Transformation outcomes show persistence: two in three issuers retained the same B-BBEE level over the period.
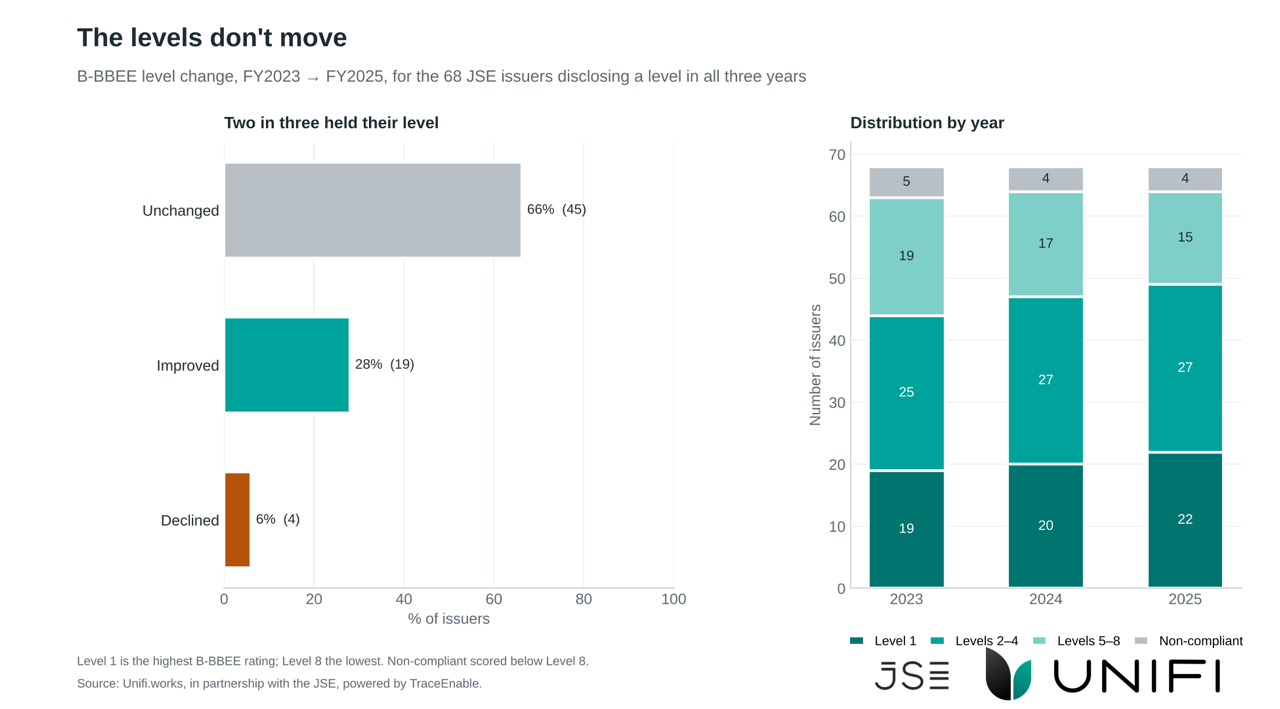
FY2023–FY2025 · the same 68 issuers reporting a level in all three years. 45 unchanged (66%); 19 improved (28%); four declined (6%).
Level 1 is the highest B-BBEE rating; Level 8 the lowest. Non-compliant is scored below Level 8. This balanced panel describes consistent disclosers and does not represent every JSE-listed issuer.
Source: Unifi.works, in partnership with the JSE, powered by TraceEnable.
From evidence to decisions
Who uses this dataset?
01 / Investment
Asset Owners & Managers
Analyse ESG portfolio exposure and compare issuers using South African indicators alongside global ESG measures.
02 / Corporate strategy
JSE-listed Issuers
Benchmark transformation, sustainability and governance performance against sector peers.
03 / Market oversight
Lenders & Regulators
Examine company disclosures, reporting trends and ESG-related indicators with transparent source context.
04 / Research
Researchers & Institutions
Study South African ESG patterns across companies, sectors and reporting years.
Products & pricing
Choose the depth. Keep the local context.
A live issuer dataset, a fixed historical baseline, or sector-relative benchmark outputs.
ESG Flagship
For ongoing issuer-level ESG analysis.
Year 1
- Full issuer-level dataset
- Three-year rolling history
- Quarterly full-load refreshes
- Sector benchmarks included
- R200,000 standard Year 2 renewal
ESG Historical Pack
For baselines, research and due diligence.
Once-off
- Full issuer dataset
- Three years of history
- Fixed at purchase date
- Sector benchmarks included
- Vintage-stamped, with no refresh
ESG Sector Benchmarks
For peer-relative performance context.
Annually
- Annual recalculation
- Sector-relative percentile outputs
- Relative intensity positioning
- No underlying raw issuer-level values
- Standalone benchmark layer
Provisional commercial terms. Headline prices match the supplied v9 factsheet (29 July 2026, marked for JSE review). Final pricing, current coverage, licensing, tax treatment and renewal terms require written confirmation from JSE Market Data. P03 renewal pricing remains under confirmation.
Compare the products in detail
| Feature | P01 · Flagship | P02 · Historical Pack | P03 · Sector Benchmarks |
|---|---|---|---|
| Coverage | Full JSE issuer-level dataset | Full JSE issuer-level dataset | Sector-level benchmark outputs |
| History | Three-year rolling history | Three years, fixed at purchase | Sector-relative positions at the benchmark anchor period |
| Update cadence | Quarterly full-load refresh | Once-off; no refresh | Annual recalculation after sufficient reporting coverage |
| Benchmark layer | Included, recalculated annually | Included, anchored to purchase date | Standalone |
| Raw issuer values | Included where disclosed | Included where disclosed | Not included |
| Delivery | Full-load CSV | Single vintage-stamped CSV | Annual benchmark CSV |
| Price | R500,000 Year 1; R200,000 standard Year 2 renewal | R400,000 once-off | R250,000 annually |
Access is provisioned through JSE Market Data Connect following agreement execution and order confirmation. Usage and redistribution are governed by the applicable JSE agreements. Confirm current product specifications and commercial terms before ordering.
JSE ESG UNIFI Data Suite
Understand South African ESG performance in context.
Want to know more? Email the UNIFI team for information about dataset coverage, product options and how the Data Suite can support your analysis.
Contact UNIFI · info@unifi.works